|
Shear zone refraction
Click on the image to see the movie
taken during shearing.
 |
Click on the image to see the movie taken during shearing.  |
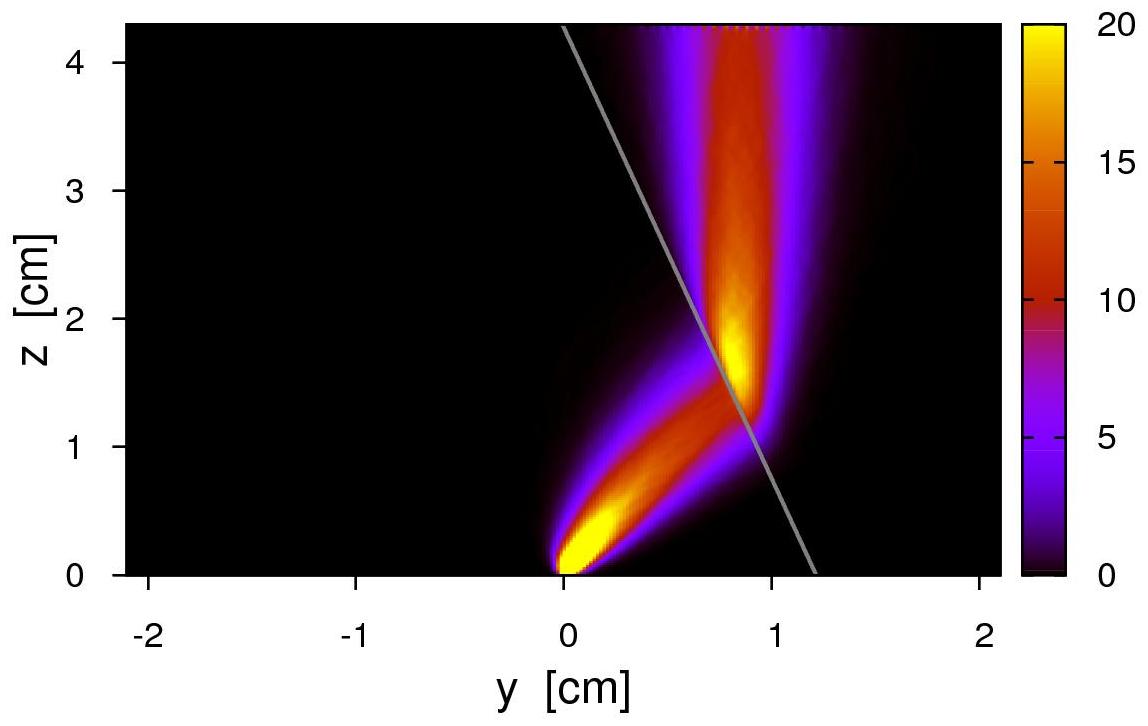
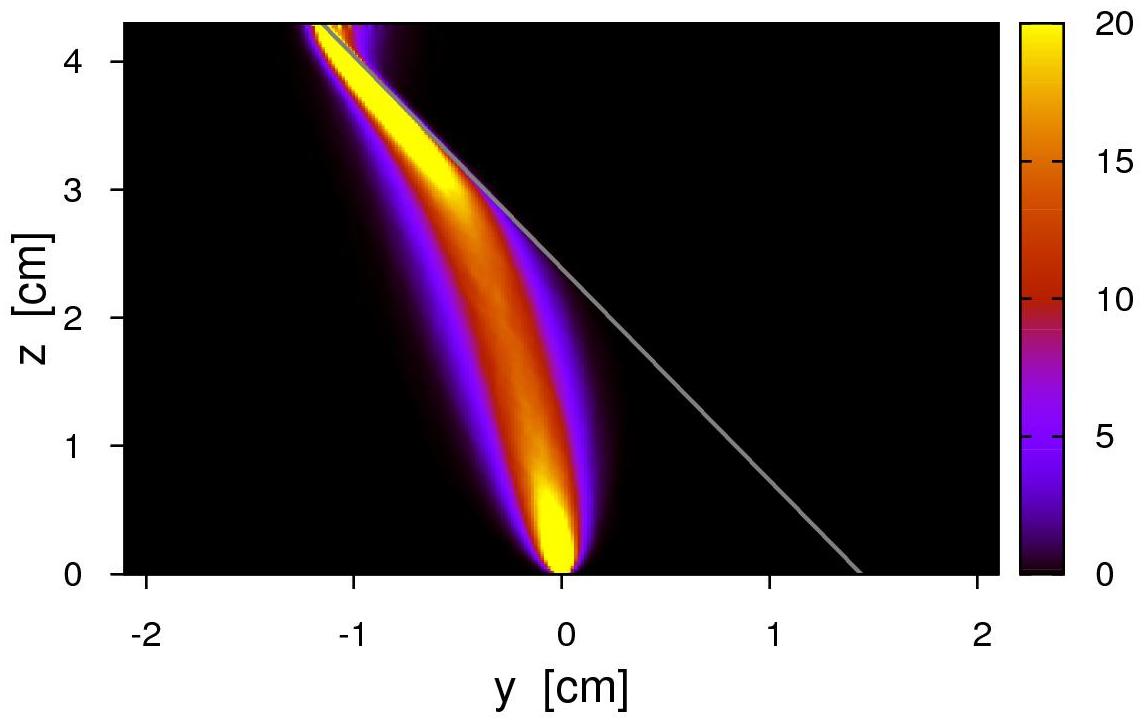
3D reconstruction
After
each experiment the displacement profile in the bulk d(y,z) was reconstructed by
removing the top surface of the material carefully layer by layer.
These profiles are presented in the images below for both
refraction and deflection, together with sample images taken during the
excavation process. The gradient of the displacement provides the local
shear strain inside the material in the y-z plane which is shown at the
plots below the displacement profiles. In the first case the zone,
starting from the bottom, takes a short path towards the
interface and by reaching the low friction region it changes direction
abruptly and heads straight to the top. In the second case the zone
starts in the low friction material it deflects to avoid the high
friction region even if it takes a much longer path. Further
measurements to explore the internal deformation using MRI are on the
way.
|
Shear zone refraction
Click on the image below to see a movie
of the subsequent layers from top to bottom during removing.
 |
Click on the image below to see a movie of the subsequent layers from top to bottom during removing.  |
Numerical simulation results
The computer simulation is
performed based on the fluctuating narrow band model [Phys.
Rev. Lett., 92, 214301
(2004), Phys.
Rev. E 75, 011305 (2007)].
According to this model the deformation occurs along the weakest
sliding surface through the random medium. An ensemble average over the
random realizations of the granular medium provides the shape and width
of the shear zone. A cross section of the numerical system
is shown below
for two simulations corresponding to the two experimental systems.
(click on the images to
magnify)
 |
 |
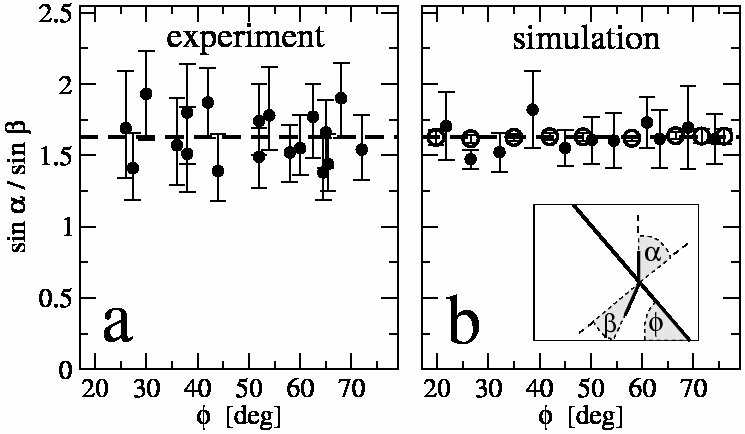
Verifying Snell's law
Numerous experiments and
simulations have been performed to test whether Snell's law is valid
for this system. As described above it is expected that the relative
index of refraction is replaced by the ratio of the
effective frictions. We estimated the ratio of the effective frictions
by measuting the angle of repose for both materials and the
experimentally obtained value was 1.63. We compare this number with the
raio of the sines of the angles of incidence (see inset of graph b
below). The ageement is very good for both experiments and simulations.
Experimental details
|
The experimental results were obtained using a straight split bottom cell (see picture). The internal cross section had dimensions of 4.2 cm x 4.5 cm. The shear cell included two 60 cm long L shaped sliders, one of which was slowly translated in experiments with total displacement between 5 and 6 cm. The internal walls of the sliders were covered by sandpaper to prohibit slip at the walls. Here the cell is filled with corundum doped with poppy seeds (tracers). The cell is not filled until the end sothat during translation the material is not pushed by the end walls. Translation is obtained by the slow rotation of the screws. |
(click on the image to magnify) 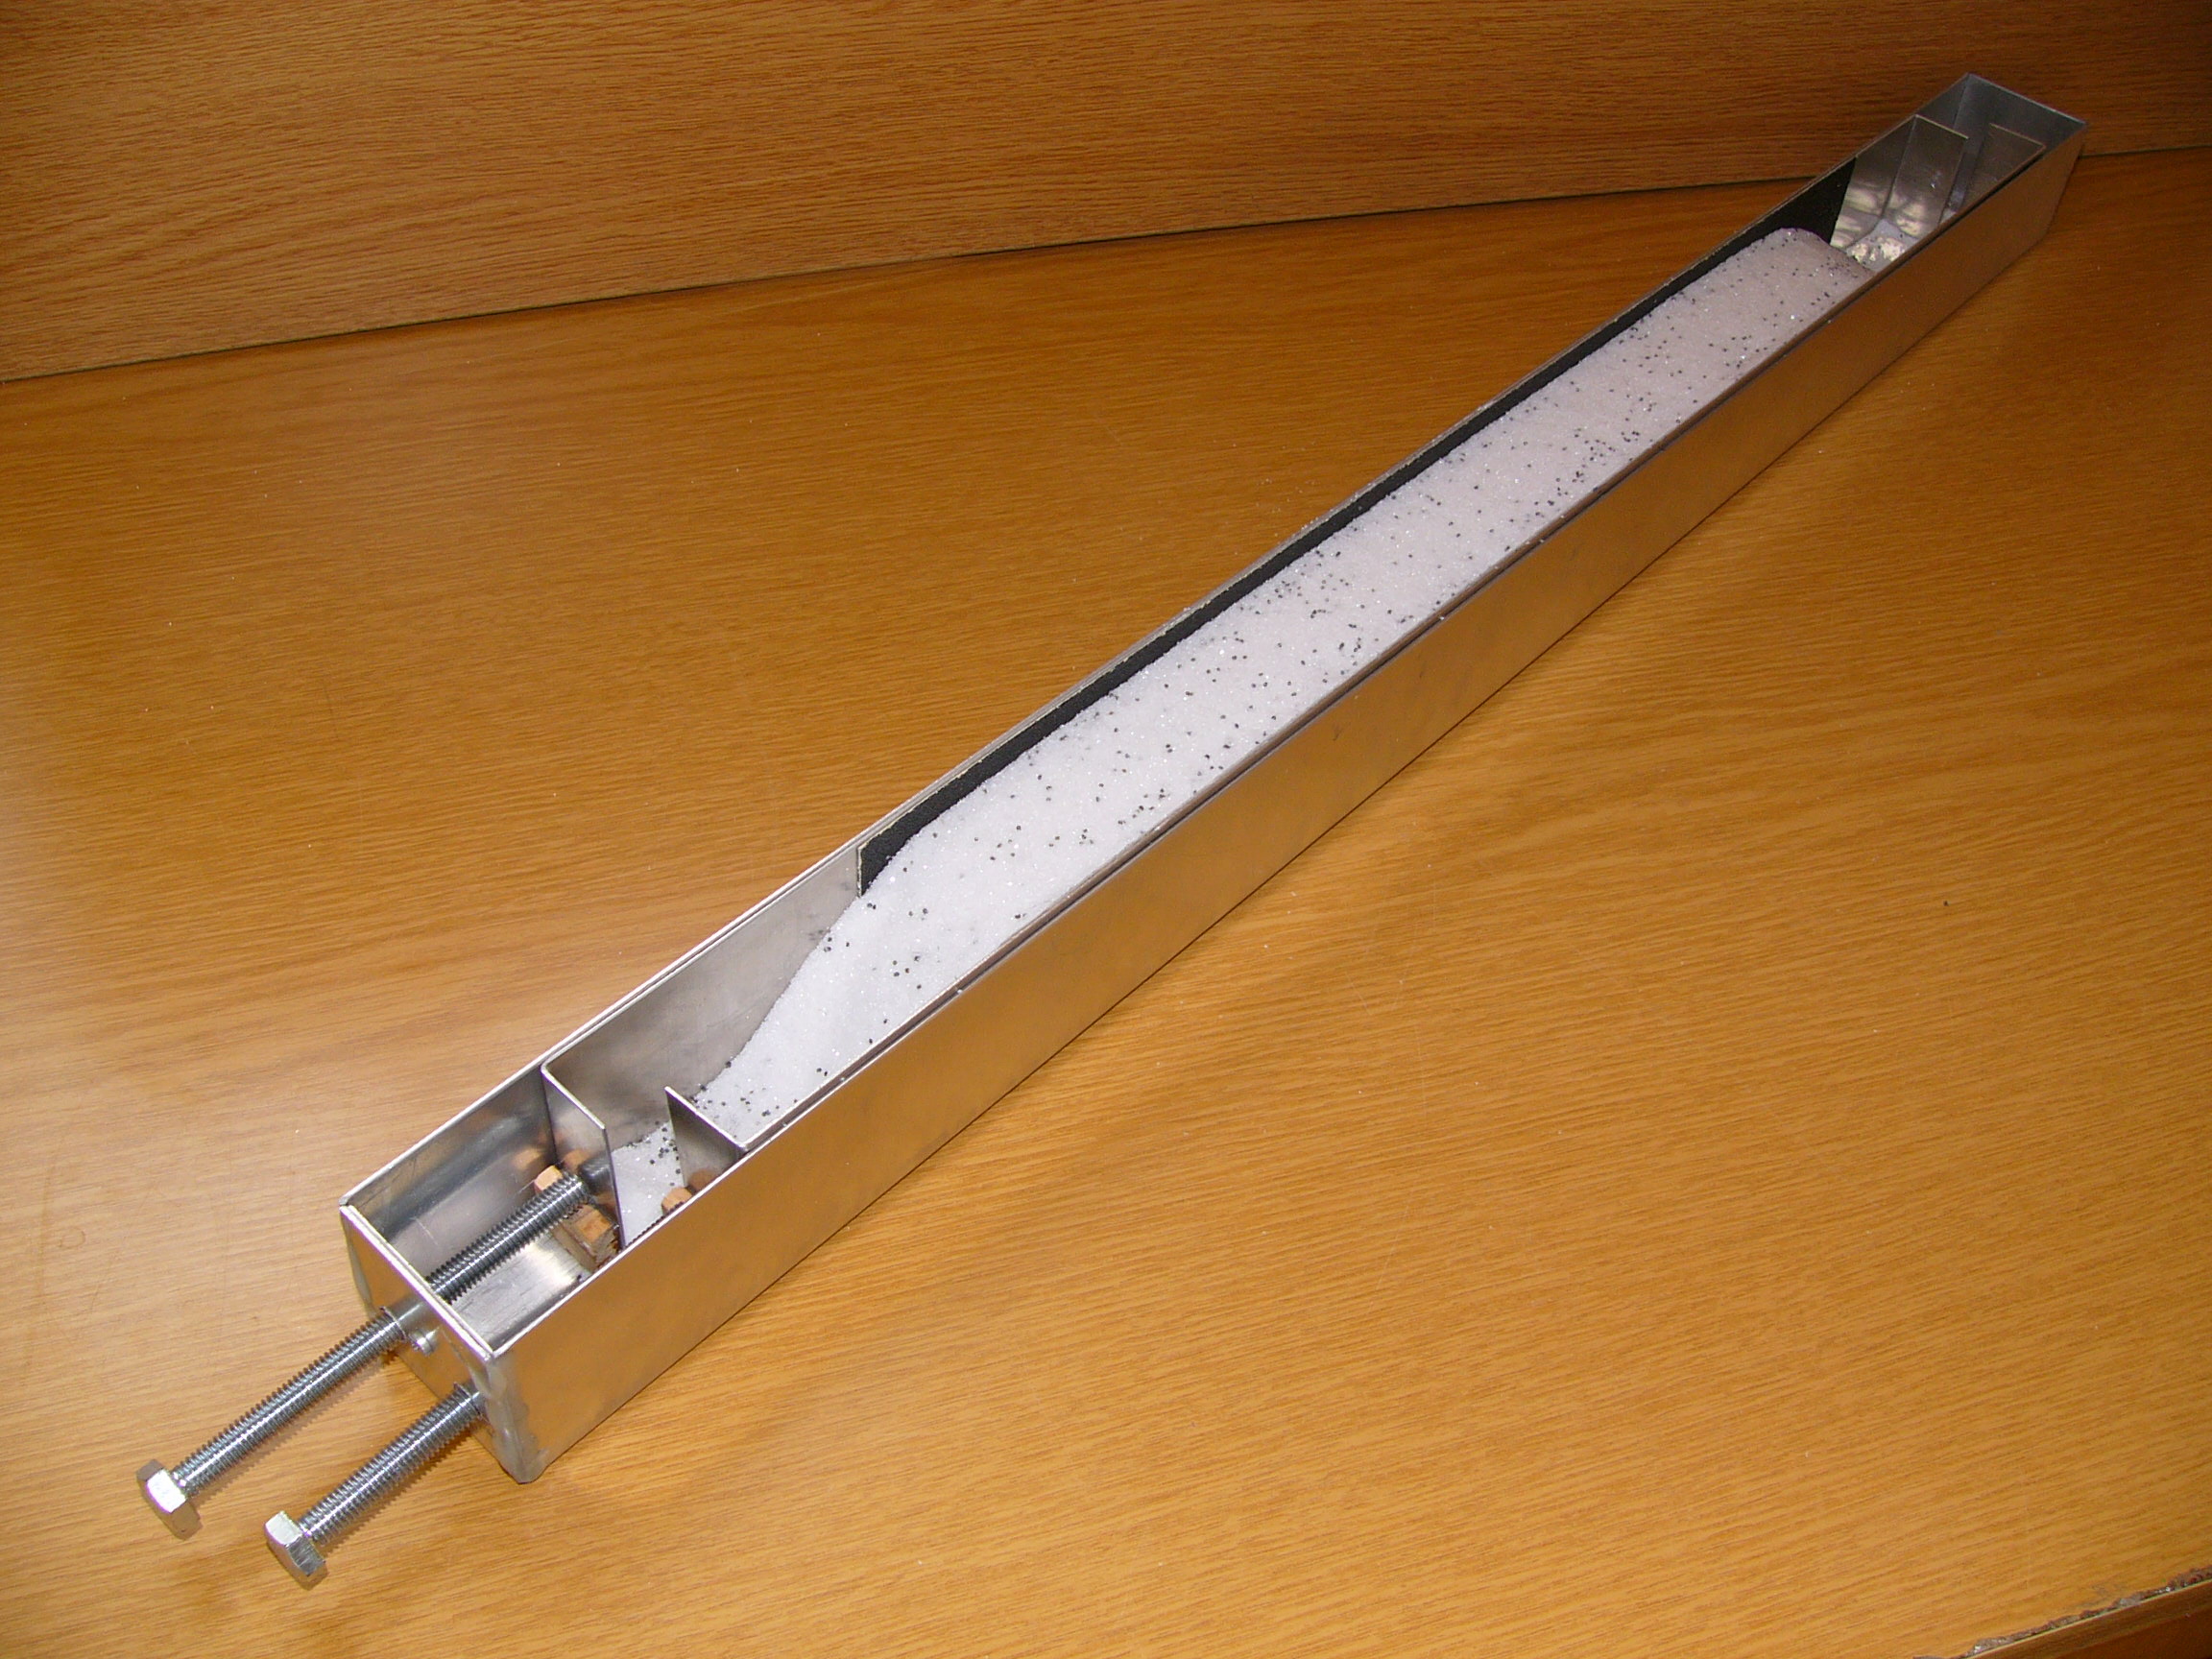 |
Further experimental results
|
Here we present further
four
configurations as illustrated on the images below. In the first two
configurations we present the shear localization in a homogeneous
material. In all geometries two
measurements were performed (i) first the right slider was translated,
(ii) second the left slider was traslated. Surface distorsions are
presented in the four graphs below for each measurement (click on the image to magnify).
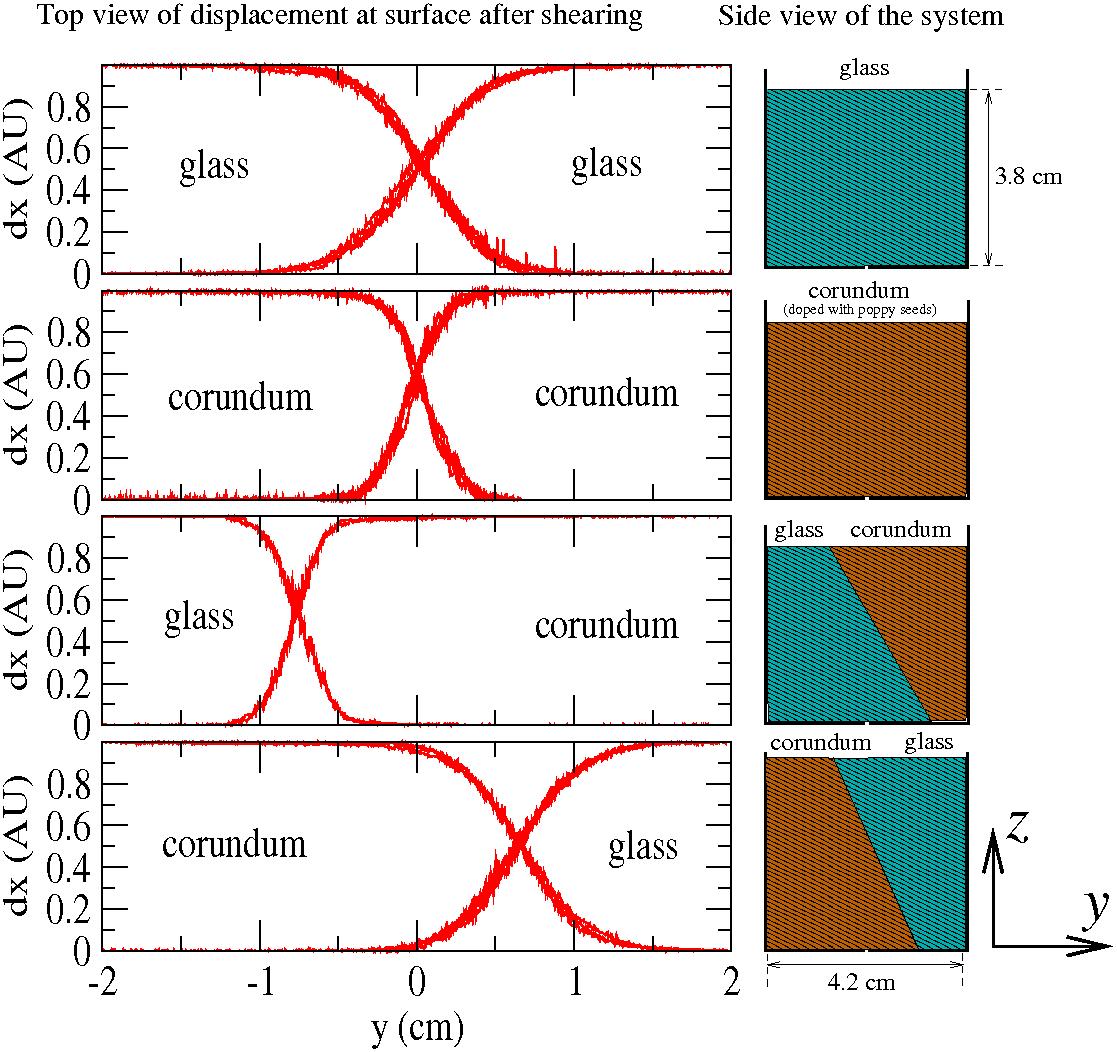 As it is seen on the graph,
the
shear-zone is wider for glass than for corundum (see first two graphs)
which is a consequence of the difference in grain size (0.655mm vs
0.36mm). In the first two experiment the middle of the zone is in the
middle of the cell as it is expected. In the third experiment the shear
zone is shifted towards the left hand side as friction is lower in
glass beads. As seen above in such a configuration
the shear zone is not refracted but it is simply deviated. In
experiment No. 4 the shear zone is shifted towards the
right hand side at the surface corresponding to shear zone refraction.
|
By clicking on the images below movies
corresponding to the experimental data can be seen.
glass  corundum (doped with poppy seeds)  glass - corundum  corundum - glass  |