|
Dense granular flows
are often
observed to become unstable and form inhomogeneous structures in nature
or industry. Although recently significant advances have been made in
understanding simple flows [P. Jop, Y. Forterre and
O. Pouliquen, Nature 441, 727
(2006)], instabilities are often not understood in detail. We
present experimental and numerical results that show the spontaneous
formation of
longitudinal stripes that arise from instability of the uniform flowing
state of granular media on a rough inclined plane. The form of the
stripes depends critically on the mean density of the flow with a robust form of stripes at high
density that consists of fast sliding pluglike regions (stripes) on top
of highly agitated boiling material (see image a) - a
configuration reminiscent of the Leidenfrost effect when a droplet of
liquid lifted by its vapor is hovering above a hot surface.
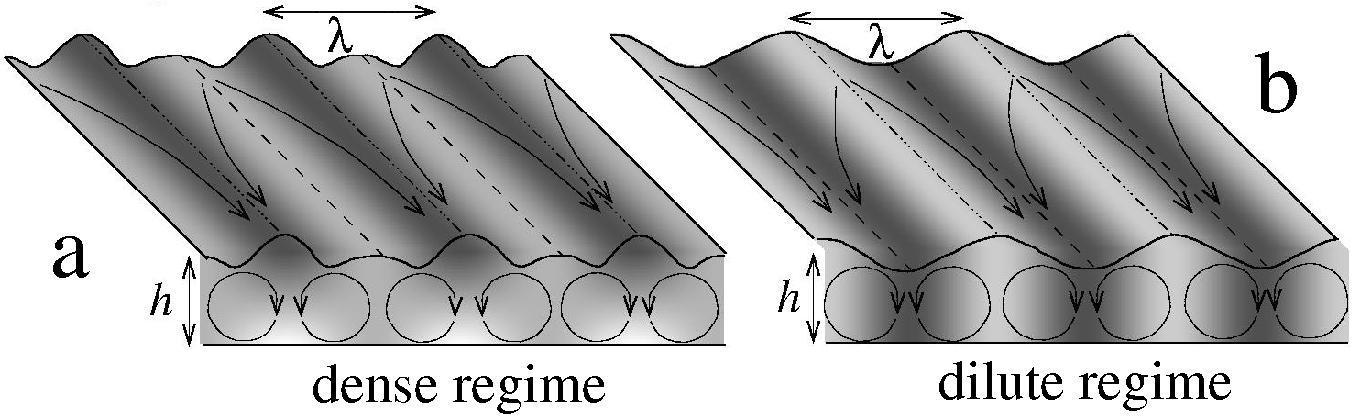 We also show that there is a continous transition to the structure already observed [Y. Forterre and O. Pouliquen, Phys. Rev. Lett. 86, 5886 (2001)] for dilute flows where the height maxima (corresponding to the fast sliding regions) are absent and the flow is the fastest at the height minima (see image b). Both regimes can be observed for various materials such as sand, glass beads or various copper samples with different particle shape as it is presented at this page. All movies recorded at 4000 frames/sec. |
 Movie of the pattern taken in the dense regime for sand of d=0.2mm:  |
|
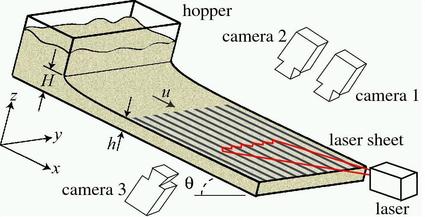
Experimental characterization of the
regimes by measuring the mean density:
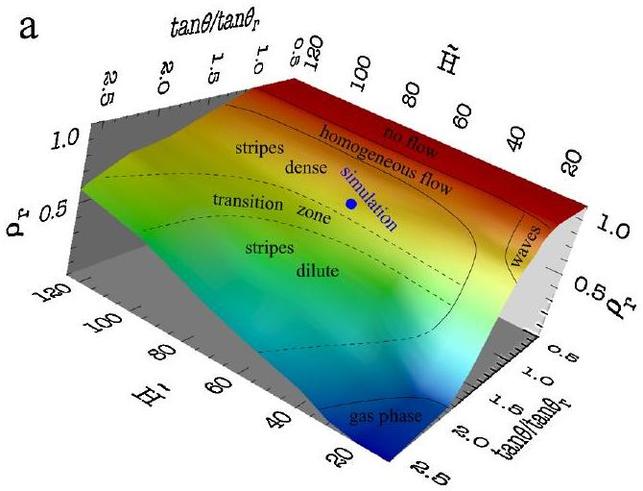
Stripes are present above a
critical plane inclination as it is illustrated on the following phase
diagram. The average density of the flow falls in the range of 0.6-0.95
and 0.2-0.7 for the two types of stripes, respectively, in terms of the
static density.
 Experimental data obtained in the dense regime: Height profiles taken at various flow thicknesses: 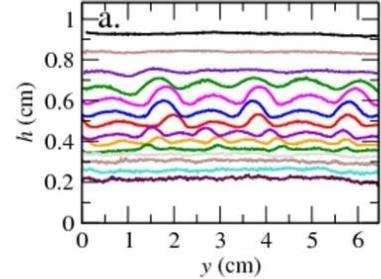 Surface fluidization monitored by a reflected laser line: 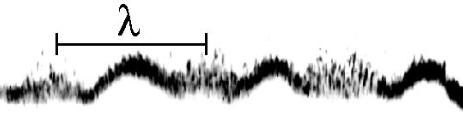 Normalized wavelength as a function of the normalized mean flow thickness: 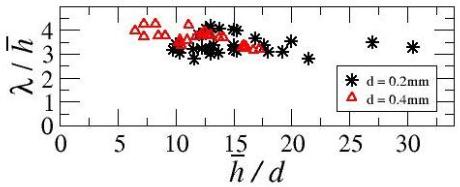
|
(Simulations done by Jim N. McElwaine at Cambridge) The first plot (a) shows the
downstream velocity while plot (b) shows
the in plane velocity (streamlines included). Note that the in plane
circulation is much slower compared to the modulation of the downstream
velocity.
Plot (c) shows the relative density while plot (d) visulizes spatial variations of the inertial number. From these two datasets one can determine how the packing fraction depends on the inertial number, which is shown in plot (e). The most interesting data set is the nonmonotonous dependence of the effective friction on the inertial number (f). Such a dependence can obviously lead to the decomposition of the system into a plug like region of lower effective friction and a highly agitated region with moderate effective friction. 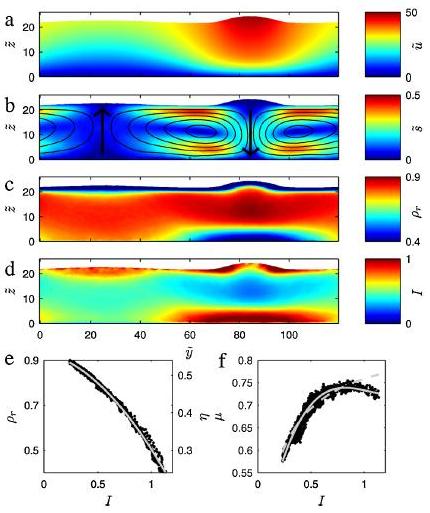 By clicking on the image below a
movie of the numerical simulations can
be seen.
 |
|
Images of the pattern and the corresponding lateral velocity profiles... 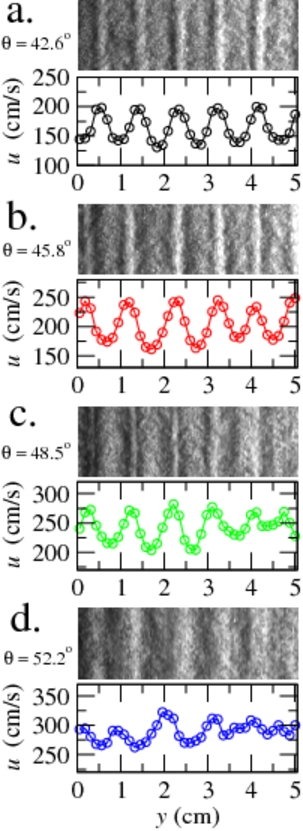 |
...and the corresponding movies. Movie taken at 42.6 degrees:  Movie taken at 45.8 degrees:  Movie taken at 48.5 degrees:  Movie taken at 52.2 degrees:  |
 |
Movie taken at 42.6 degrees (dilute regime):  |
 |
Movie taken at 42.6 degrees (dilute regime):  |