RMC
|
RMC++ examples |
This page
shows some examples of early RMC++ studies.
These simulations were made
by the original RMC++ code, but the conclusions are valid for the later
versions as well.
|
Liquid CCl4 |
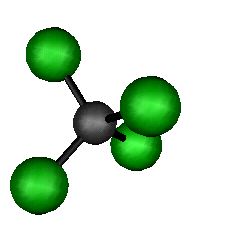
Liquid CCl4 provides a nice
example of the use of RMC++:
- The tetrahedral molecule can be well defined by the
means of fixed neighbours constraints.
- The molecule can be made flexible enough to allow
atoms to move one by one.
- There is enough space between the molecules to allow
the atom moves.
The data
The data used were obtained by neutron diffraction at
the Budapest PSD neutron diffractometer.
The data Q-range is 0.55 to 9.15 ů¹, in 100 points
(irregularly sampled).
Configuration size
The density of our sample is 0.0319 atoms per cubic
Å. A configuration with 1000 atoms (200 molecules) would fit in a cubic
box of dimension 31.53 Å (which is adequate if there is no long range
order beyond 31.53 / 2=15.76 Å).
However, for the sake of statistical accuracy, a greater number of molecules is necessary, and we choose to build a configuration with
2048 molecules, i.e. 10240 atoms.
This yields a cubic box of size 68.4704 Å, i.e. a histogram range
of 34.23522 Å (in the standard version, i.e. without the RMC++
extension).
This size complies with the requirement imposed by the Q-range of the data: the
greatest distance binned in the histograms must be at least 2 π / 0.55=
11.4 Å (one full r-period for the lowest Q value).
(n.b. the reason for
using 4 or 5 decimals accuracy does obviously not derive from physics, but from
numerical requirements)
Histograms bin width
The highest Q value imposes that the bin width dr
is at most 2 π / (5 x 9.15)= 0.137 Å.
With a configuration of 2048 molecules, one can attempt a bin width of 0.1
Å. The validity of this choice can be checked a posteriori by
looking at the histograms.
If there are not enough distances to secure the information on wants to derive
from the run, then the size of the configuration or the size of the histogram
bins can be increased.
Distances of closest approach (cutoffs)
The distances of closest approach between atoms are defined from external a
priori information: previous runs, other experiments, known structure,
guesses... In the worst case it can be imposed by the density. But in practice,
they have to be adjusted due to the necessity to allow individual atoms to
move.
(n.b.: if the cutoffs have
to be made smaller than a value known to be true in order to allow the
configuration to evolve, then the resulting configuration is not realistic)
In the CCl4 case, we chose the cutoffs as follows:
- 3.3 Å for the C-C minimum distance.
- 1.69 Å for the C-Cl distance.
- 2.7 Å for the Cl-Cl distance.
These were
partly imposed by the molecular geometry, although with RMC++, individual
molecules are defined by the fixed neighbours constraints (FNC), which
overrides the cutoffs (i.e. within one
molecule, the cutoffs can be not satisfied if
this is imposed by the FNC).
Fixed neighbours constraints
We take advantage of the FNC to mimic the individual
CCl4 molecules, i.e. we define links and allowed distance ranges between
given atoms so that the geometry of the CCl4 molecules is reproduced.
The FNC's are defined by the molecule geometry. For CCl4 there are just two
constraints:
- The C-Cl distance was set between 1.69 and 2.19
Å
- The Cl-Cl distance was set between 2.7 and 3.5
Å
In defining
these distances, it is important to keep in mind that the configuration evolves
by moving atoms individually. Therefore, the constraints must leave a
certain freedom of movement to the atoms, in order to allow the configuration
to evolve. If the geometry of the molecule imposes very strict FNC's (e.g.
flat or rigid molecules) then the individual moves of atoms is ruled out if one
wants to obtain a realistic configuration. In this case, the molecules have to
be moved as a whole, this is possible with RMCmol
(under development).
Move amplitudes
The amplitude of the individual atomic moves is
defined in the .dat file of run parameters. It has to
be adjusted to allow the configuration to evolve. Small moves will be more
likely to be accepted, but with a small effect, yielding a slow evolution. On
the contrary, large moves will make big steps, but with a larger probability of
being rejected (see the discussion in the RMCA manual).
Therefore, in practice, these amplitudes are often adjusted after a few test
runs.
Note that the move amplitudes are defined by the maximum
range in each direction (and therefore the effective range is greater by
a factor 1.732).
For CCl4, we used maximum moves of 0.1 Å.
Making the starting configuration
There are programmes to create starting configurations
(see the download page).
If there is enough space for molecules to move, a simple recipe is to
- create a configuration with molecules
arranged regularly (because this is easy), and satisfying all
constraints.
- make a RMC run without data.
The result is a maximally disordered system that satisfies the
constraints.
- make a few trial runs with the data
in order to adjust move parameters (the acceptance ratios should be around
0.5).
- once the move parameters are set,
make a run with possibly a weak constraint to fit the data, and no
renormalisation.
At this
stage, one should have a `good starting configuration'.
The RMC run
From a `good starting configuration', the run
parameters can be fine-tuned. Experience shows that the RMC result does not
depend on the starting configuration.
The duration of the run is very variable, depending on the problem.
For CCl4, starting from a good configuration, we made a 20 hours run (on a 2
Pentium III processor 500 Mhz PC).
The convergence of the algorithm is shown below, for the three different codes:
RMCA (fortran) and RMC++ (2
different compilers).
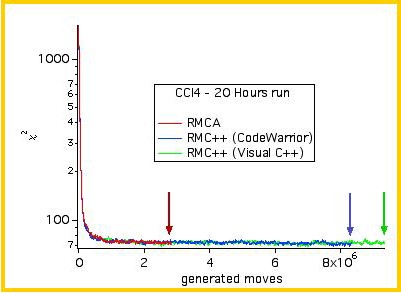
The evolution
of the χ² is typical of a RMC run.
Incidentally, the figure above shows that RMC++ is 2~3 times as fast as RMCA.
The results
The run results consist in the configuration, and the
partials in the .out file, which allow direct visualisation of the fit to the
data:
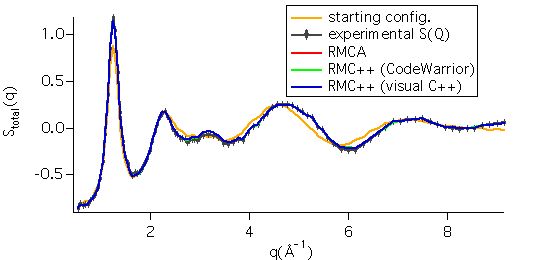
It can be
seen that the starting configuration was rather good, and that the RMC fits are
excellent.
Individual partial structure factors appear below:
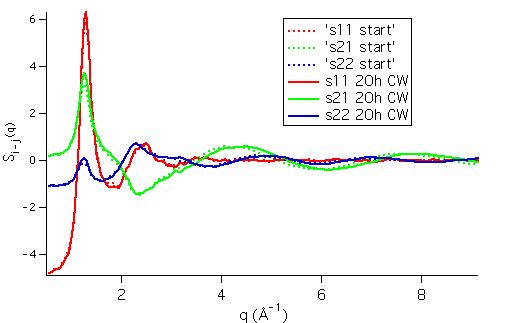
and the partial pair correlation
functions are shown below:
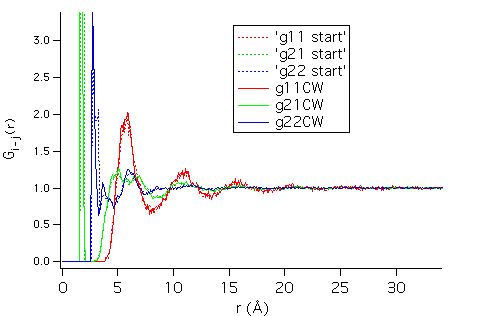
The first intramolecular
peaks C-Cl and Cl-Cl dominate the graph.
Long range order appears via the C-C partial (up to 20 ů¹),
and is due to the arrangement of neighbouring molecules. As required by the
calculation of the sine-Fourier transform, the g(r)'s are equal to 0 at the
largest calculated distances.
This `local arrangement' gives the intermolecular contribution to the
C-Cl and Cl-Cl partials.
A detailed view of the g(r) partials appear below:
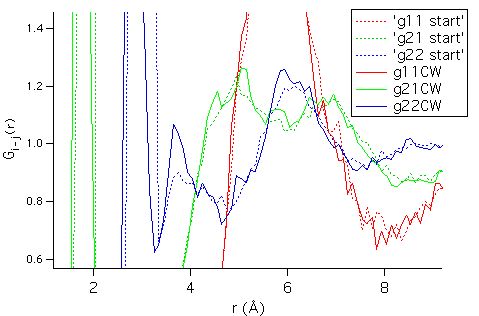
Note the
statistical oscillations that appear on the detailed level. The significance, or an estimate of the uncertainty about the g(r)
values derived from the RMC run can be guessed by looking directly at the
histograms. They appear below:
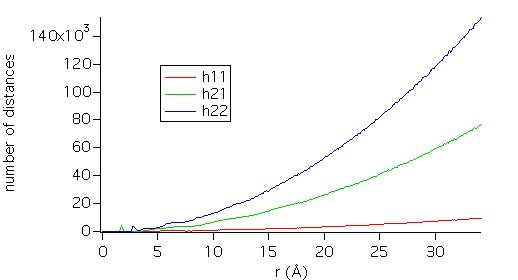
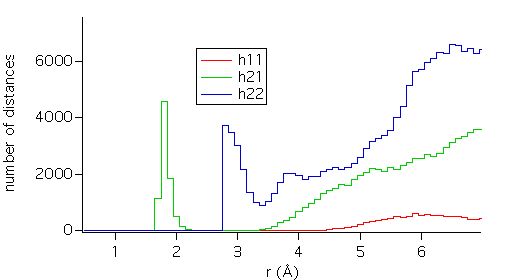
The number of
distances grows as r¯². But one is usually interested in the short
range deviation from perfect homogeneity, which appears as small peaks, as seen
in the detail below.
The configuration does much more than just allow to calculate
the g(r) partials without the usual problems of direct sine-Fourier
transformation. It is possible to calculate cosine distributions, etc...
Developing tools for exploiting RMC results actually appears as important as
implementing the RMC algorithm itself.
|
Run Reports |
Here are some RMC run reports on
a variety of materials (files in pdf format). The simulations were
performed by the original RMC++ code by Guillaume Evrard.
The following runs were
dedicated to the investigation of the effect of algorithmic constraints
rather than the study of the materials themselves.
- First try with CCl4 (a
BAD example).
- Data vs. algorithmic
constraints (I) with CCl4: a series of runs used to evaluate the
effect of constraints and data on run results.
- data
vs. constraints (II) the sequel of the above example, with CCl4.
- data vs.
constraints (III), an other investigation on
the effects of constraints and data, based on Cl2.
- Q-range extension vs. FNC,
yet another example of study of the redundant effect of a priori
constraints vs. data, this time with H20.